Go to: http://flowingdata.com/2010/05/26/bp-tries-to-mislead-you-with-graphs/
BP tries to mislead you with graphs

BP senior vice president Kent Wells explains in this new video what his group is doing towards repairing the leak. He presents the bar graph above to show the improvement in their efforts. It's increasing, so they must be improving. Nifty. The problem is that it's cumulative, and the rate at which they're collecting isn't improving.
From the Maddow blog:
[T]hose green bars go up because the tube has been in place since May 16. The longer it stays, the more gallons it collects. It's not necessarily collecting more oil on successive days, let alone “most” of the oil as Wells says they're trying to do.
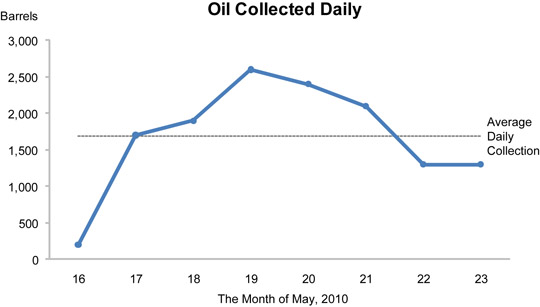
Stephen Few provides a different view, with collection rates:

Few goes on to say:
While the amount of collection increased in the beginning, it has decreased or held steady for the last four days and is now well below the average amount of daily collection for this period as a whole. Things are definitely not getting better. How do you spin bad news like this? One way is to create a misleading graph, but cover your ass by doing it in a way that isn’t an outright lie.
To put it differently, you could easily spin BP's results in the opposite direction. A cumulative graph for the amount of oil spilling into the Gulf would be an increasing one too.