SIDEBAR
»
S
I
D
E
B
A
R
«
PDF Tables: Outstanding tool extracts tables to Excel
Jun 13th, 2015 by Tom Johnson

I just gave this a spin using the City of Santa Fe 2015 budget, a 150-pager.  Seemed to be very fast in the conversion and quite accurate.  Unless you need the text, it is even faster if you edit out text pages and just run those pages containing the desired tables.  The result is that each page becomes a separate Excel page, then they can be sliced-and-diced as necessary.

Kudos to the ScraperWiki folks.

Accurately extract tables from PDFs
No more time consuming and error prone copying and pasting
https://pdftables.com/

-tj

New CMS can help monetizing quality journalism (FFx)
May 30th, 2015 by Tom Johnson

Good piece by Frederic Filloux

Monetizing digital journalism requires one key ingredient: Causing quality contents to emerge from the internet’s background noise. New kinds of Content Management Systems and appropriate syntax can help in a decisive way. 

Until now, mining good journalism from the web’s depths has been done from the top. Over the last 13 years, looking for “signals” that flag quality content has been at the core of Google News: With a search engine scanning and ranking 50,000 sources in 30 languages and 72 editions, its inventor, the famous computer Scientist Krishna Bharat, has taken his extraordinary breakthrough to an immense scale. [more]

Socrata: Analyze all the datasets
May 25th, 2015 by Tom Johnson

Socrata is a growing outfit that manages DBs for cities and non-profits.  This guy did a nice how-to page of his work with Socrata, and we thank him.

https://thomaslevine.com/!/socrata-summary/

Tracking campaign contributions with MapLight
Jun 19th, 2014 by Tom Johnson

Maplight, a 501(c)(3) foundation, recently announced its “extensive mapping project examining the geographic origin of contributions to legislators by state; contributions from companies to legislators by state; and roll call votes by state and district on key bills in Congress.”

Today’s news peg points to “Who in Your State Has Contributed Money to Majority Leader Candidate Kevin McCarthy (R-CA)?”

MapLight looks to be a good edition to our GIS toolbox.

‘Try and find Narnia in the wardrobe’: inside the work of a research specialist
Jun 5th, 2014 by Tom Johnson

Thanks to Margo Williams for passing this interview along. It’s filled with important tips and insights gained from Myers’ years of experience. Read the full interview with Myers at http://www.icij.org/blog/2014/06/try-and-find-narnia-wardrobe-inside-work-research-specialist

“Paul Myers is an internet research specialist working in the U.K. media. He joined the BBC in 1995 as a news information researcher. This followed an earlier career in computers and internet experience dating back to the 1970s.

“These days, his role sees him organise and deliver training courses related to internet investigation, digital security, social media research, data journalism, freedom of information and reporting statistics. His techniques have helped his colleagues develop creative approaches to research, conduct their investigations securely and have led many journalists to information they would never have otherwise been able to find. He has worked with leading British T.V. & radio news, current affairs, documentaries and consumer programmes.”

Important conference on Quantifying Journalism at Columbia J-School
May 30th, 2014 by Tom Johnson

The first Tow Research conference, Quantifying Journalism: Metrics, Data and Computation, on May 30, 2014 reflected on a big year in data journalism. Quantifying Journalism: Data, Metrics, and Computation brought together academics, practitioners and technologists to explore three critical questions at the heart of the data journalism conversation.
https://www.youtube.com/watch?v=JMDMCIv0-So

An up-dated data clean-up tool at Google-Refine
Nov 14th, 2010 by Tom Johnson

Check out Google-Refine at http://code.google.com/p/google-refine/

Logo


Google Refine is a power tool for working with messy data, cleaning it up, transforming it from one format into another, extending it with web services, and linking it to databases like Freebase.


Reporting Complexity (with Complexity)
Mar 31st, 2010 by Tom Johnson

“Reporting Complexity (with Complexity): General Systems Theory, Complexity and Simulation Modeling

See the PPT slides from a vid-conference lecture from Santa Fe to

INDIANA UNIVERSITY – PURDUE UNIVERSITY
INDIANAPOLIS
School of Public and Environmental Affairs
School of Journalism 
COURSE: Mass Media & Public Affairs
March 31, 2010
=============================================================================

How to Make a Heatmap – a Quick and Easy Solution
Jan 21st, 2010 by analyticjournalism

Thanks to Nathan at Flowing Data:

How to Make a Heatmap – a Quick and Easy Solution

How to Make a Heatmap – a Quick and Easy Solution

How do you make a heatmap? This came from kerimcan in the FlowingData forums, and krees followed up with a couple of good links on how to do them in R. It really is super easy. Here's how to make a heatmap with just a few lines of code, but first, a short description of what a heatmap is.

The Heatmap

In case you don't know what a heatmap is, it's basically a table that has colors in place of numbers. Colors correspond to the level of the measurement. Each column can be a different metric like above, or it can be all the same like this one. It's useful for finding highs and lows and sometimes, patterns.

On to the tutorial.

Step 0. Download R

We're going to use R for this. It's a statistical computing language and environment, and it's free. Get it for Windows, Mac, or Linux. It's a simple one-click install for Windows and Mac. I've never tried Linux.

Did you download and install R? Okay, let's move on.

Step 1. Load the data

Like all visualization, you should start with the data. No data? No visualization for you.

For this tutorial, we'll use NBA basketball statistics from last season that I downloaded from databaseBasketball. I've made it available here as a CSV file. You don't have to download it though. R can do it for you.

I'm assuming you started R already. You should see a blank window.
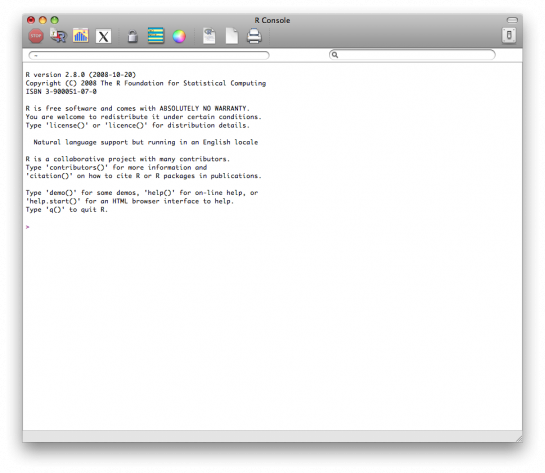
Now we'll load the data using read.csv().

nba <- read.csv("http://datasets.flowingdata.com/ppg2008.csv", sep=",")

We've read a CSV file from a URL and specified the field separator as a comma. The data is stored in nba.

Type nba in the window, and you can see the data.
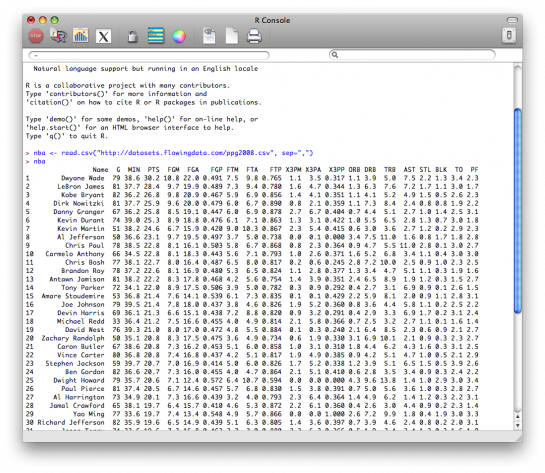
Step 2. Sort data

The data is sorted by points per game, greatest to least. Let's make it the other way around so that it's least to greatest.

nba <- nba[order(nba$PTS),]

We could just as easily chosen to order by assists, blocks, etc.

Step 3. Prepare data

As is, the column names match the CSV file's header. That's what we want.

But we also want to name the rows by player name instead of row number, so type this in the window:

row.names(nba) <- nba$Name

Now the rows are named by player, and we don't need the first column anymore so we'll get rid of it:

nba <- nba[,2:20]

Step 4. Prepare data, again

Are you noticing something here? It's important to note that a lot of visualization involves gathering and preparing data. Rarely, do you get data exactly how you need it, so you should expect to do some data munging before the visuals. Anyways, moving on.

The data was loaded into a data frame, but it has to be a data matrix to make your heatmap. The difference between a frame and a matrix is not important for this tutorial. You just need to know how to change it.

nba_matrix <- data.matrix(nba)

Step 5. Make a heatmap

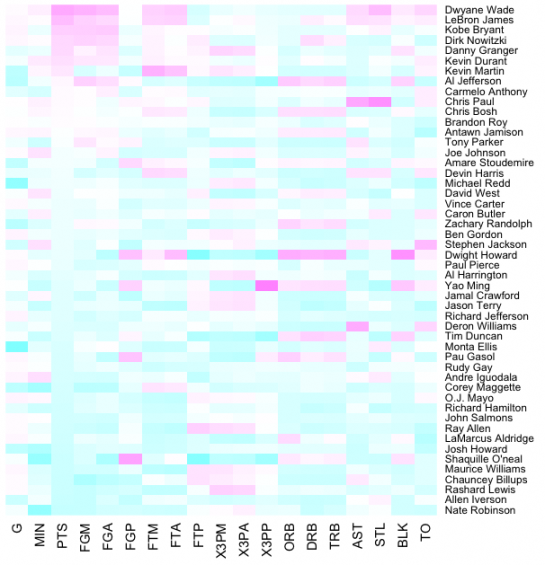
It's time for the finale. In just one line of code, build the heatmap (remove the line break):

nba_heatmap <- heatmap(nba_matrix, Rowv=NA, Colv=NA,

col = cm.colors(256), scale="column", margins=c(5,10))

You should get a heatmap that looks something like this:
Step 6. Color selection

Maybe you want a different color scheme. Just change the argument to col, which is cm.colors(256) in the line of code we just executed. Type ?cm.colors for help on what colors R offers. For example, you could use more heat-looking colors:

nba_heatmap <- heatmap(nba_matrix, Rowv=NA, Colv=NA,

col = heat.colors(256), scale="column", margins=c(5,10))
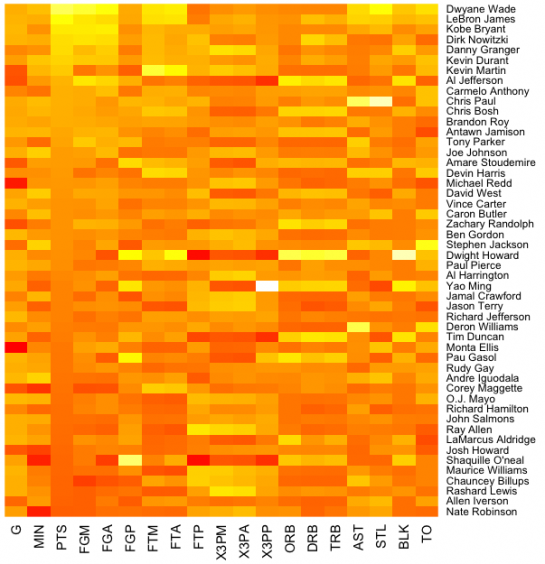
For the heatmap at the beginning of this post, I used the RColorBrewer library. Really, you can choose any color scheme you want. The col argument accepts any vector of hexidecimal-coded colors.

Step 7. Clean it up – optional

If you're using the heatmap to simply see what your data looks like, you can probably stop. But if it's for a report or presentation, you'll probably want to clean it up. You can fuss around with the options in R or you can save the graphic as a PDF and then import it into your favorite illustration software.

I personally use Adobe Illustrator, but you might prefer Inkscape, the open source (free) solution. Illustrator is kind of expensive, but you can probably find an old version on the cheap. I still use CS2. Adobe's up to CS4 already.

For the final basketball graphic, I used a blue color scheme from RColorBrewer and then lightened the blue shades, added white border, changed the font, and organized the labels in Illustrator. Voila.
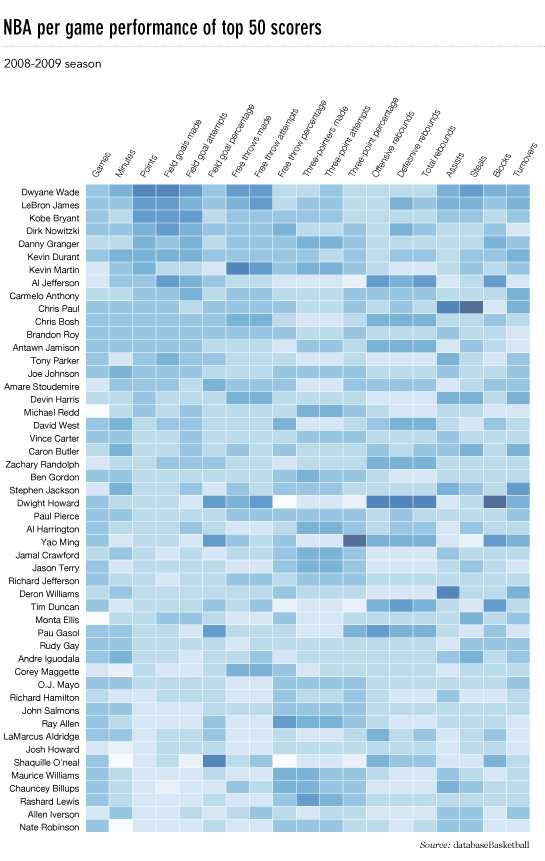
Rinse and repeat to use with your own data. Have fun heatmapping.


Distributed Data Analysis at Facebook
Dec 1st, 2009 by analyticjournalism

This is a few months old, but we're wondering if any readers have used Hive or tried to deploy it in newsrooms, where “exploring and analyzing data…[is] everyone's responsibility.”

Distributed Data Analysis at Facebook

Exploring and analyzing data isn’t the responsibility of one team here at Facebook; it’s everyone’s responsibility. “Move fast” is one of our core values, and to facilitate fast data-driven decisions, the Data Infrastructure Team has created tools like Hive and its UI sidekick, HiPal, to make analyzing Facebook’s petabytes of data easy for anyone in the company. The Data Science team runs open tutorial sessions for groups eager to run their own analysis using these tools. And non-programmers on every team have fearlessly rolled up their sleeves to learn how to write Hive queries.

Today, Facebook counts 29% of its employees (and growing!) as Hive users. More than half (51%) of those users are outside of Engineering. They come from distinct groups like User Operations, Sales, Human Resources, and Finance. Many of them had never used a database before working here. Thanks to Hive, they are now all data ninjas who are able to move fast and make great decisions with data.

If you like to move fast and want to be a data ninja (no matter what team you are in), check out our Careers page.


»  Substance:WordPress   »  Style:Ahren Ahimsa